Skip to content

add darwin mixin #2236

New issue

Have a question about this project? Sign up for a free GitHub account to open an issue and contact its maintainers and the community.

By clicking “Sign up for GitHub”, you agree to our terms of service and privacy statement. We’ll occasionally send you account related emails.

Already on GitHub? Sign in to your account

Closed
wants to merge 3 commits into from
Closed

add darwin mixin #2236

wants to merge 3 commits into from

Conversation

rlankfo
Copy link
Contributor

@rlankfo rlankfo commented Dec 3, 2021

This PR adds support for Darwin dashboards in the mixin. The memory usage statistics do not work with the existing dashboards as they use metrics gathered from Linux's meminfo collector. This updates the memory sections in Darwin dashboard to use the vmstat metrics collected in meminfo_darwin.go

@discordianfish
Copy link
Member

Great, thanks!
Wondering though if we could make the existing dashboards support darwin instead of creating separate ones. Basically use a promsql expression that either uses the vmstat metrics or the linux meminfo metrics. That would also fix the cluster view which currently with darwin in the mix probably shows misleading results.

@rlankfo
Copy link
Contributor Author

rlankfo commented Dec 6, 2021

@discordianfish thanks for the feedback! I had assumed what I was doing was probably not correct but wanted to at least get this out there to get some feedback on what a better approach might be. I will attempt to update these to use a single dashboard with a promql query as you suggest.

@discordianfish
Copy link
Member

That would be perfect! But even if that doesn't work, I'd be okay with including a separate macos dashboard.

rlankfo added 2 commits April 7, 2022 15:06
Signed-off-by: Robbie Lankford <[email protected]>
@rlankfo
Copy link
Contributor Author

rlankfo commented Apr 7, 2022

@discordianfish I've updated the Darwin dashboards introduced in this PR to use the internal_bytes and purgeable_bytes (introduced in #2240) metrics for the memory panels.

I also looked into adding support for Darwin in the existing node dashboard using a promql expression with the node_uname_info{} metric where sysname=Darwin but ran into some problems with that approach. It's been a bit since I looked into it but at the time I couldn't make it work cleanly. I don't mind looking into this again, if you can provide some direction; otherwise, if you're ok with the separate dashboard approach it works for now and could make sense over time if the dashboards continue to deviate.

@tpaschalis @v-zhuravlev

@discordianfish
Copy link
Member

I haven't looked into it closer, so dunno how feasiable it is to have them all in one dashboard. What issues did you run into?
Otherwise separated dashboards are okay I guess. /cc @SuperQ

@rlankfo
Copy link
Contributor Author

rlankfo commented Apr 18, 2022

I haven't looked into it closer, so dunno how feasiable it is to have them all in one dashboard. What issues did you run into? Otherwise separated dashboards are okay I guess. /cc @SuperQ

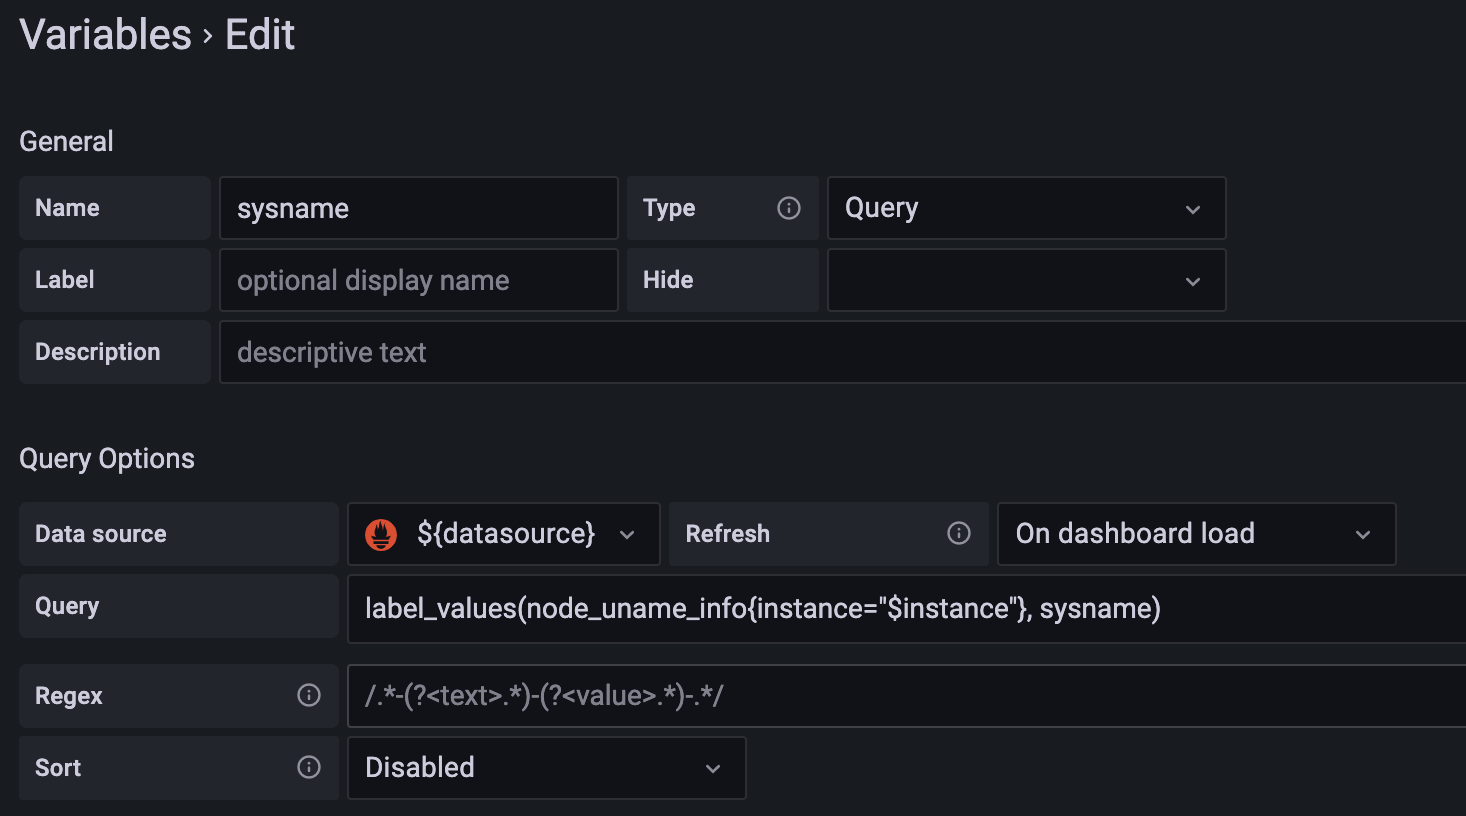
The only way I can tell how to determine the sysname in the dashboard (at runtime) is to create a new dashboard variable using label_values(), for example:
image

This seems to work, but from here I can't seem to figure out how to conditionally display one set of metrics in a panel using promql based on the value of $sysname. Additionally, the panels are different enough that the legends won't be the same either since this updates the memory panel to display the stats similar to the Apple activity monitor. It could be that I just don't have sufficient knowledge of promql, so I'm open to suggestions here.

Another thought was to pass an argument to the mixin (perhaps on $._config ) and having the branching logic in jsonnet. Do you have any thoughts on this approach?

@rlankfo
Copy link
Contributor Author

rlankfo commented Apr 20, 2022

closing in favor of #2351

@rlankfo rlankfo closed this Apr 20, 2022
@v-zhuravlev
Copy link
Contributor

v-zhuravlev commented Apr 20, 2022

@rlankfo I think to have both mac/linux on the same dashboard , we need this be implemented:
grafana/grafana#4470
then memory graphs can be shown/hidden conditionally.
Meanwhile, I believe it is better to go with two separate dashes.

@rlankfo
Copy link
Contributor Author

rlankfo commented Apr 20, 2022

@rlankfo I think to have both mac/linux on the same dashboard , we need this be implemented: grafana/grafana#4470 then memory graphs can be shown/hidden conditionally meanwhile, I believe it is better to go with two separate dashes.

awesome, thanks @v-zhuravlev. great work!

Sign up for free to join this conversation on GitHub. Already have an account? Sign in to comment
Labels
None yet
Projects
None yet
Development

Successfully merging this pull request may close these issues.

3 participants