Regression line not appearing over scatterplot when using .add(so.Line(), so.PolyFit()) #3091
Description
I'm trying to create a scatterplot with a regression line over the top. When I try to do this with .add(so.Line(), so.PolyFit()) the trend line fails to appear.
Here is the code that I'm using to attempt to create the scatterplot + regression line:
import pandas as pd
import seaborn.objects as so

supercars = pd.read_csv('https://learn.sharpsightlabs.com/datasets/pdm/supercars.csv')


(so.Plot(data = supercars
         ,x = 'horsepower'
         ,y = 'top_speed'
         )
   .add(so.Dot())
   .add(so.Line(), so.PolyFit())
 )
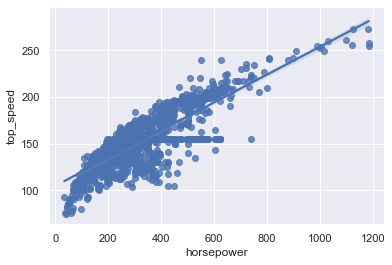
And here is the output:

As you can see, the scatterplot plots as expected, but the regression line is missing.
To show you what I'm expecting to appear, I'll create a "regplot" with 'sns.regplot':
import seaborn as sns

sns.regplot(data = supercars
         ,x = 'horsepower'
         ,y = 'top_speed'
         )
OUT:
As you can see, with the traditional "regplot" the scatterplot has a regression line over it.
I think that in my Seaborn Objects code is correct, but perhaps I've made a mistake.
If not, and my code is correct, then it seems that there's a bug in how Seaborn Objects is operating on this particular dataset.