Computed coordinate variables do not respond to scale config #2885
Description
(
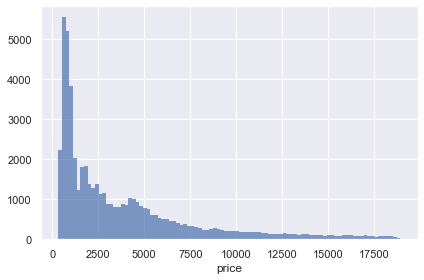
so.Plot(diamonds, "price")
.add(so.Bar(edgewidth=0, width=1), so.Hist(binwidth=200))
.scale(y="log")
)
(
so.Plot(diamonds, "price")
.add(so.Bar(edgewidth=0, width=1), so.Hist(binwidth=200))
.scale(y="log")
)