fix: clear rect uses transparent background #5
Conversation
This file contains hidden or bidirectional Unicode text that may be interpreted or compiled differently than what appears below. To review, open the file in an editor that reveals hidden Unicode characters.
Learn more about bidirectional Unicode characters
kt3k
approved these changes
Dec 20, 2022
Member
 kt3k
left a comment
kt3k
left a comment
There was a problem hiding this comment.
We can now use charts in non white background. Looks like a nice improvement. Thanks! LGTM 👍
BEFORE
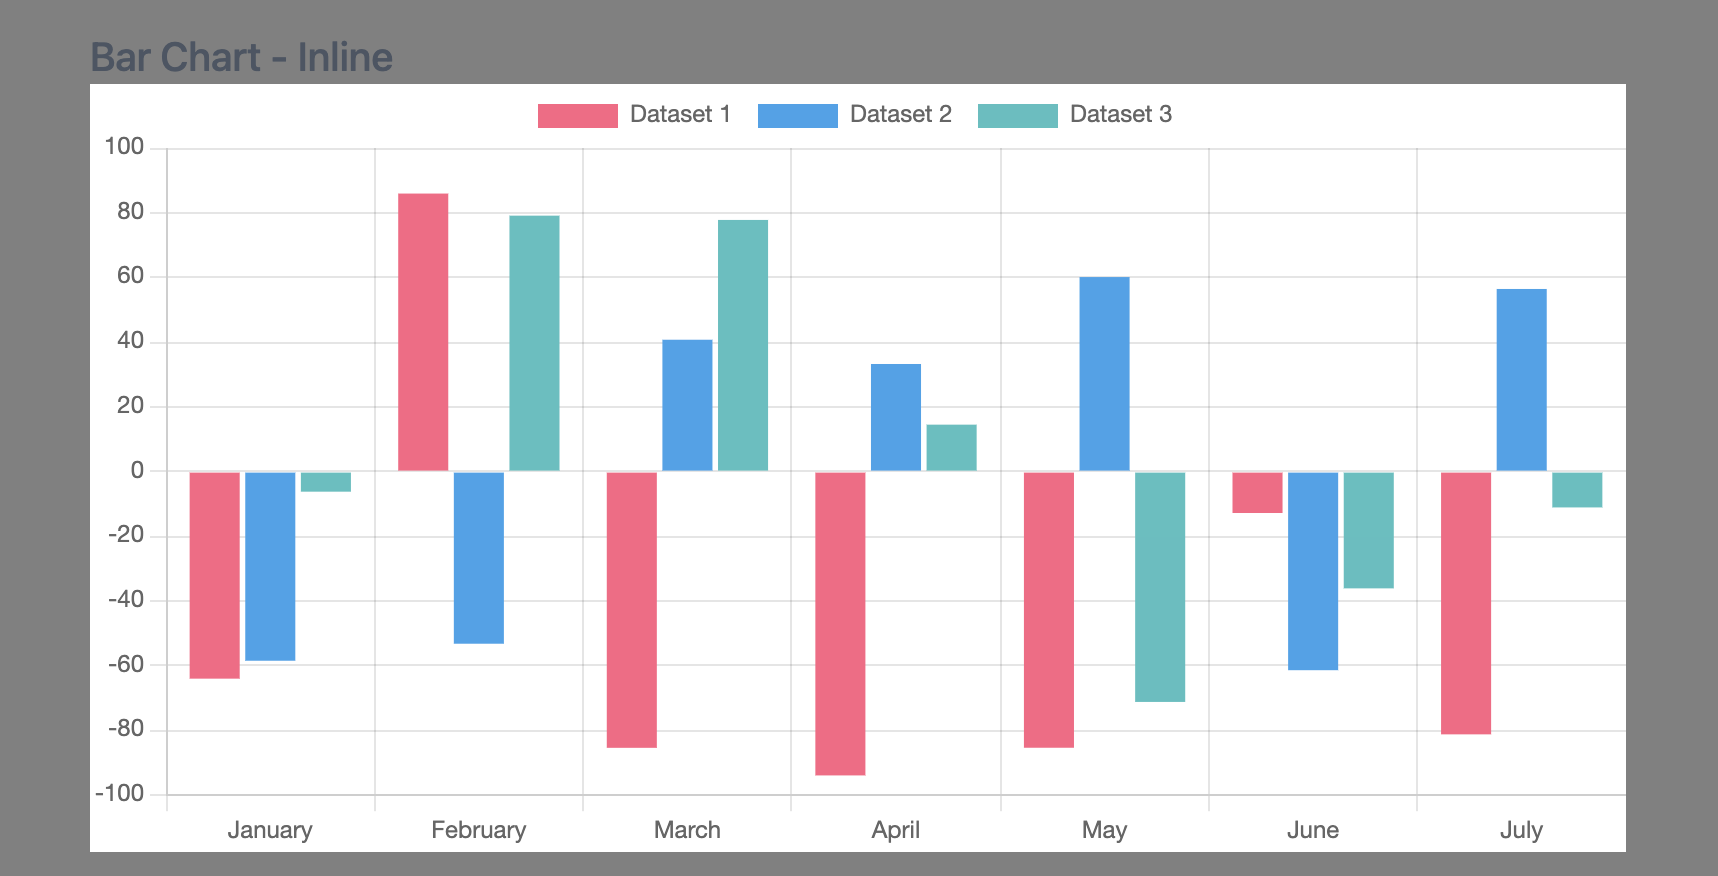
AFTER

Sign up for free
to join this conversation on GitHub.
Already have an account?
Sign in to comment
2 participants
Add this suggestion to a batch that can be applied as a single commit.
This suggestion is invalid because no changes were made to the code.
Suggestions cannot be applied while the pull request is closed.
Suggestions cannot be applied while viewing a subset of changes.
Only one suggestion per line can be applied in a batch.
Add this suggestion to a batch that can be applied as a single commit.
Applying suggestions on deleted lines is not supported.
You must change the existing code in this line in order to create a valid suggestion.
Outdated suggestions cannot be applied.
This suggestion has been applied or marked resolved.
Suggestions cannot be applied from pending reviews.
Suggestions cannot be applied on multi-line comments.
Suggestions cannot be applied while the pull request is queued to merge.
Suggestion cannot be applied right now. Please check back later.
This builds on PR #4 and can be rebased when #4 is merged, but ChartJS uses ".clearRect()" to clear the charting area, but the
SvgCanvaswas incorrectly setting the fill to"white"instead of"transparent", but canvas are supposed to be transparent by default, causing any charts to render with a white background irrespective of the document background. It doesn't work as a general purpose solution, because the SvgCanvas "stacks" the calls to the canvas, meaning that clearRect wouldn't work in general purpose use cases, but does for ChartJS, therefore it can't really be upstreamed.