Add the "atldld dataset preview" command #66
Conversation
* Add type annotations
* Configure the plotted figure in the CLI module
* Change plot titles
* Add the plane_of_section parameter to preview plot
There was a problem hiding this comment.
I tried the CLI and I really like it 😍 Thanks for the PR, @Stannislav !
One small thing, it seems sometimes corners can be out of the boundaries of the reference shape, especially for the coronal axis. See for example atldld dataset preview 77371835
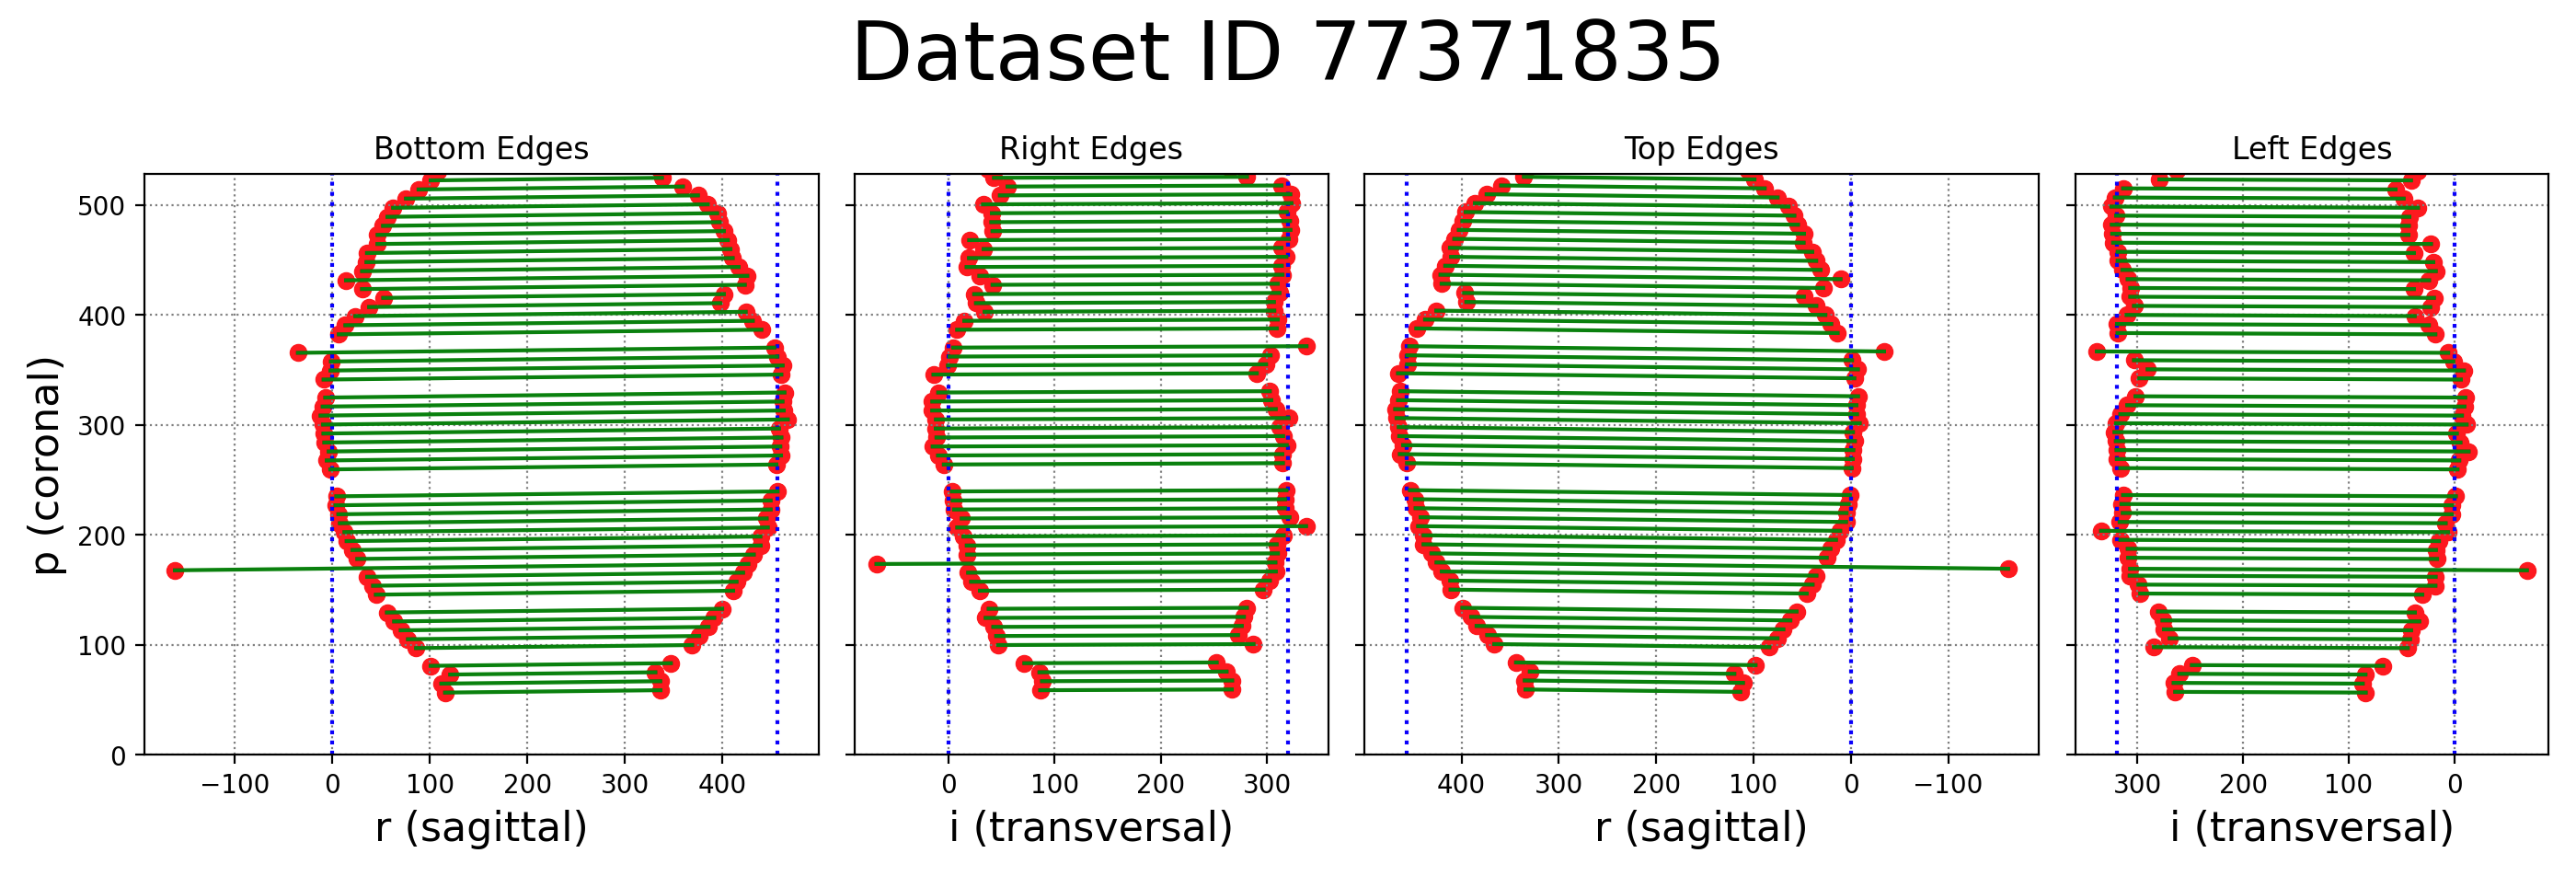 . Maybe we can extend the boundary of the coronal axis for those datasets ?
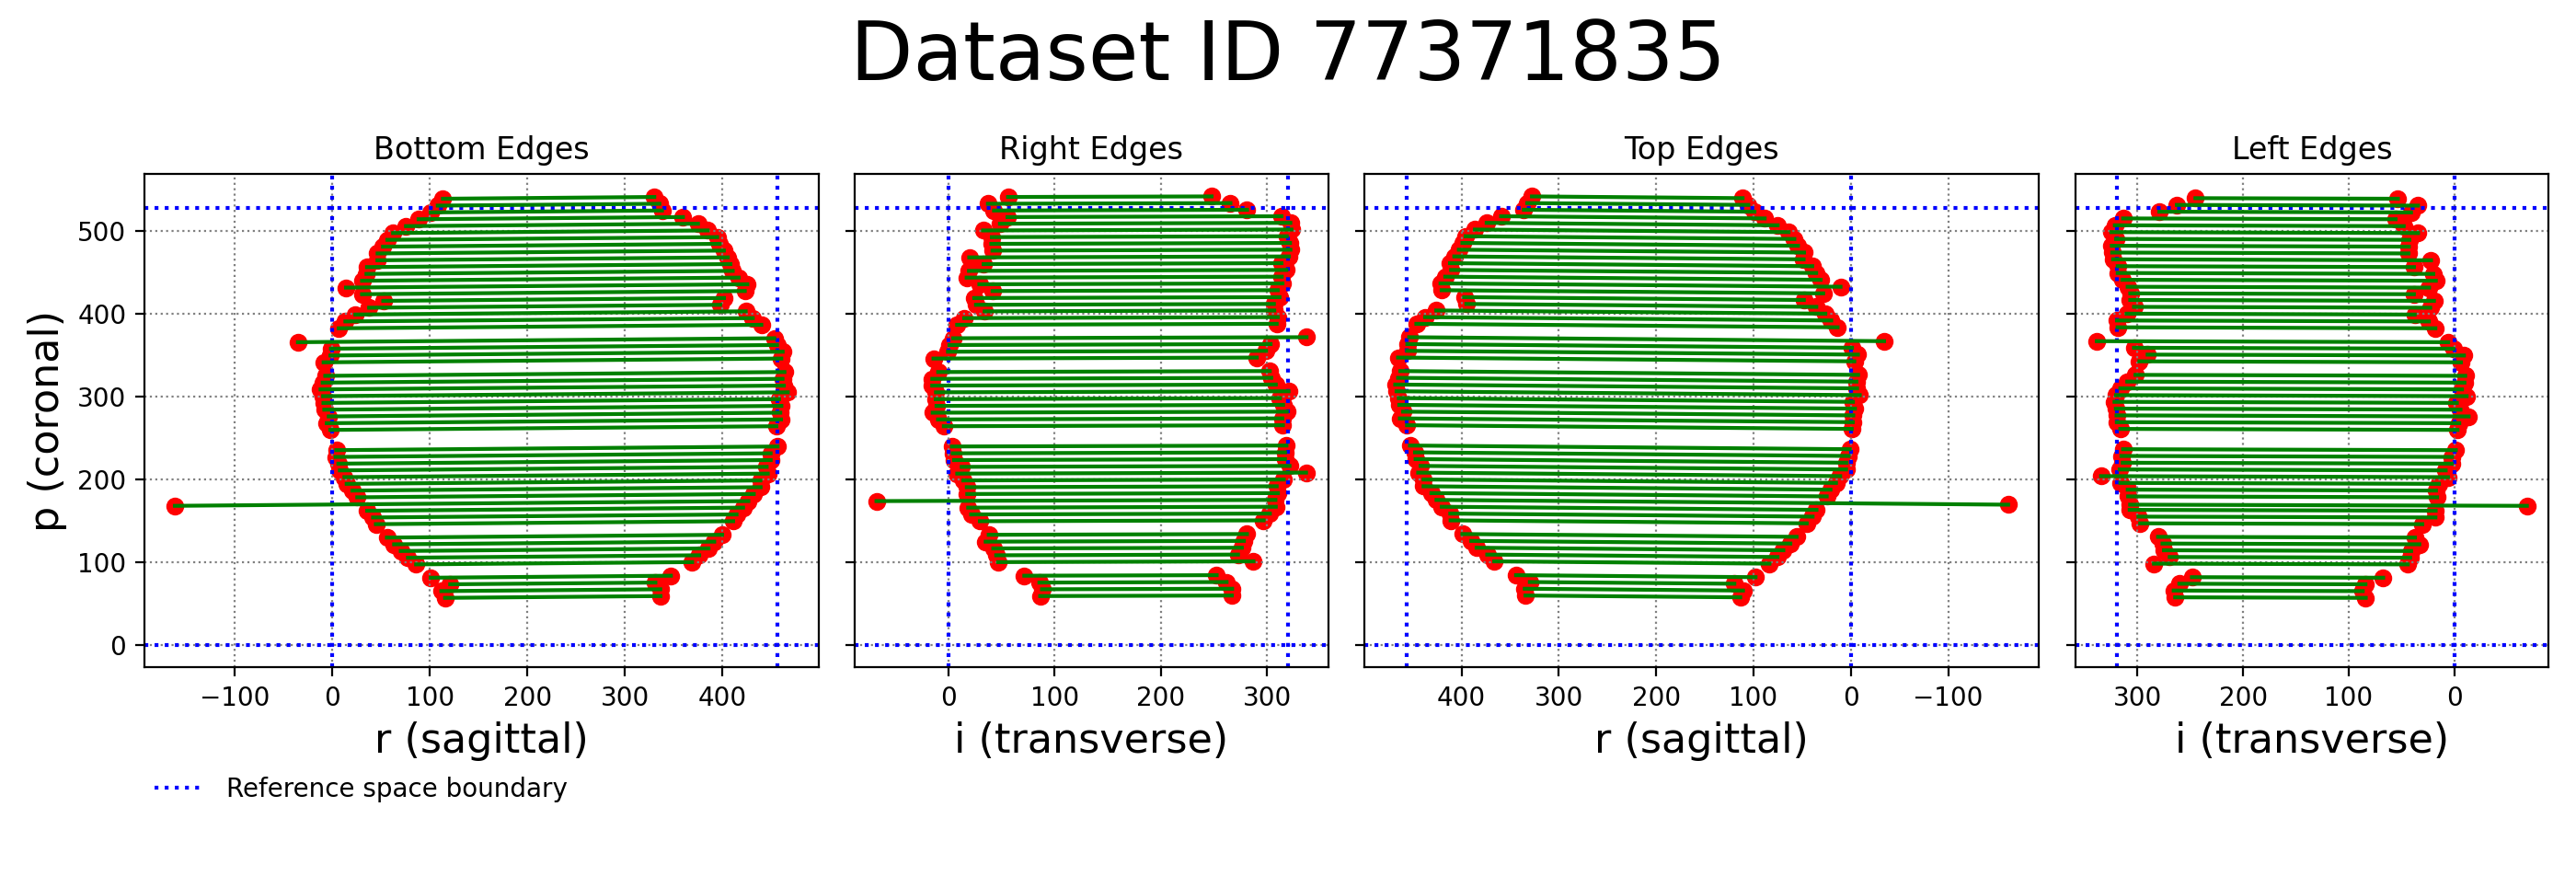
Nice catch! I removed the
|
This reverts commit cb7e9a7.

The bug-causing library importlib-metadata==4.8.0 was yanked
from PyPI.
Sounds great! Thanks for changing this! |
It determines the locations of all section images in the reference space and saves a plot to disk.
I tested with
atldld dataset preview 479atldld dataset preview 75492803but feel free to test with other datasets, maybe you'll discover some bugs.