Monitoring
Rexster comes with a variety of options for monitoring given its integration with Metrics. Rexster continually gathers information about itself as it is accepting requests and sending back responses. This information is then periodically sent to the reporters configured in rexster.xml. Rexster supports the following reporters:
The metrics provided by Rexster can help inform administrators of Rexster’s health and include things like:
- Gremlin script engine processing times
- RESTful endpoint request/response times
- Underlying JMX attributes from Grizzly and Jersey
All configuration of metrics reporting is handled through rexster.xml. With in that file, there is a <metrics> element, which contains one or more <reporter> elements. These <reporter> elements represent places where Rexster will make gathered metrics available. Basic reporter configuration looks like this:
<rexster>
  ...
  <metrics>
    <reporter>
      <type>console</type>
    </reporter>
  </metrics>
  ...
</rexster>
The <type> may be one of the following options: console, http, jmx, ganglia or graphite.
| type | description | behavior | common 1 |
|---|---|---|---|
console |
Metrics written to the console at predefined periods. | scheduled push | Yes |
http |
Metrics served via HTTP as a REST-based service. | on-demand | No |
jmx |
Metrics served as MBean to be consumed by tools like VisualVM. | on-demand | No |
ganglia |
Metrics pushed to Ganglia on a schedule. | scheduled push | Yes |
graphite |
Metrics pushed to Graphite on a schedule. | scheduled push | Yes |
1 – Uses Common Configuration settings explained below.
To include Grizzly-level JMX attributes in reported metrics, ensure that the <enable-jmx> option is set to true for either the <http> and/or <rexpro> configuration elements.
Rexster provides configuration options for several different reporters.
When the Console Reporter is configured, Rexster will periodically send its metrics to the console output. This reporter is mostly useful for debugging and demonstration purposes. Output looks something like:
4/26/13 5:01:14 PM =============================================================

-- Counters --------------------------------------------------------------------
rexpro.script-engine.fail
             count = 0
rexpro.script-engine.success
             count = 113650
-- Timers ----------------------------------------------------------------------
rexpro.script-engine
             count = 114633
         mean rate = 4074.89 calls/second
     1-minute rate = 1464.61 calls/second
     5-minute rate = 442.48 calls/second
    15-minute rate = 252.12 calls/second
...The HTTP Reporter configures a servlet that converts metrics to JSON and serves them on request. After starting Rexster, metrics can be accessed at:
http://localhost:8182/metrics{
"name": "rexster",
"version": "3.0.0",
"counters": {
"rexpro.script-engine.fail": {
"count": 0
},
"rexpro.script-engine.success": {
"count": 359677
}
},
...
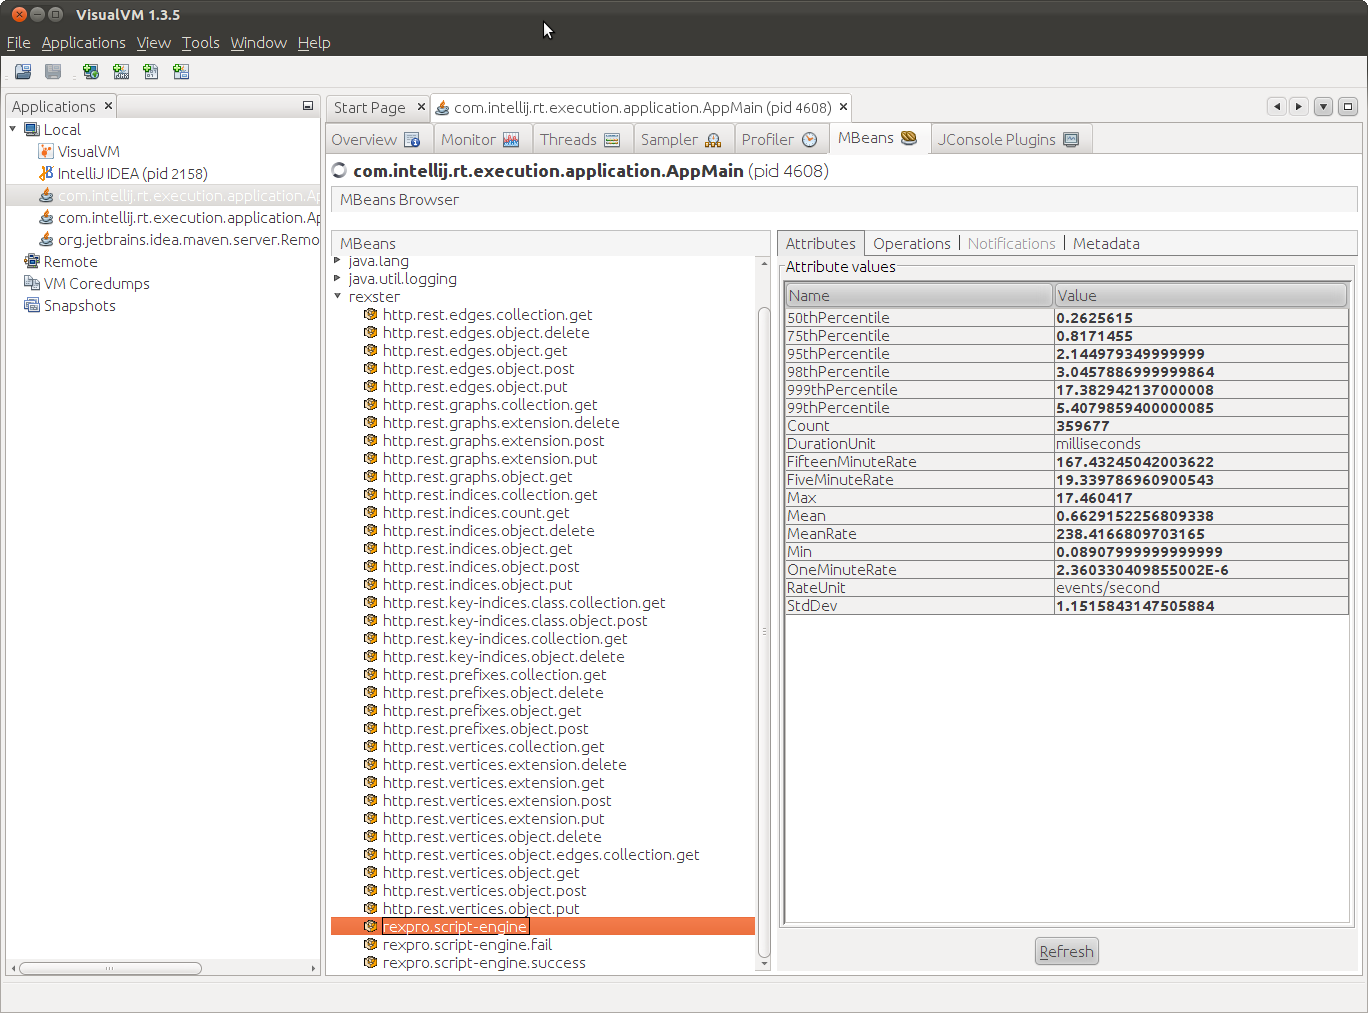
}When JMX is configured as a reporter, it is possible to use a tool like VisualVM to connect to the running JVM process. There is a rexster MBean that contains the metrics:
Ganglia is a scalable distributed monitoring system for high-performance computing systems. When Ganglia is configured as a reporter, Rexster will periodically send metrics to a Ganglia server. In addition to the Common Configurations (described below), the Ganglia <properties> can include:
<properties>
  <hosts>localhost:8649</hosts>
</properties>
The <hosts> property tells the reporter the server to send the metrics to and the example value supplied above is the default value for the configuration if none is specified. The metrics are sent via UDP multicast addressing.
Graphite is a highly scalable real-time graphing system. When Graphite is configured as a reporter, Rexster will periodically send metrics to a Graphite server. In addition to the Common Configurations (described below), the Ganglia <properties> can include:
<properties>
  <hosts>localhost:2003</hosts>
  <prefix></prefix>
</properties>
The <hosts> property tells the reporter the server to send the metrics to and the example value supplied above is the default value for the configuration if none is specified. The <prefix> represents an additional user-defined key to append to the front of metrics reported. By default this value is an empty string.
Reporters that “push” metrics on a schedule have common configuration and default settings as set through the <properties> element of the <reporter>. The common configuration looks like this:
<reporter>
  ...
  <properties>
    <rates-time-unit>SECONDS</rates-time-unit>
    <duration-time-unit>SECONDS</duration-time-unit>
    <report-period>60</report-period>
    <report-time-unit>SECONDS</report-time-unit>
    <includes>http.rest.*</includes>
    <excludes>http.rest.*.delete</excludes>
   </properties>
</reporter>
The time unit values correspond to the java.util.concurrent.TimeUnit enum values of:
- NANOSECONDS
- MICROSECONDS
- MILLISECONDS
- SECONDS
- MINUTES
- HOURS
- DAYS
The <rate-time-unit> and <duration-time-unit determine the unit of time at which data will be formatted when reported. The <report-period> and <report-time-unit determine how often the data will be sent out via the reporter. The default settings for these values are shown above in the sample configuration.
Rexster generates many metrics and not all may be useful. It is possible to filter these metrics with the <includes> and <excludes> elements. Both take a regex statement to filter metric keys in or out of the reported set.